Qlik Sense and QlikView are two data discovery tools that make it easy to go from raw data to data visualization. This in contrast to Tableau that is limited to combining data tables with joins. If your data source is, for example, an OLTP system that contains a long list of table with complex relationships, you will probably have to invest time to transform and model the data in another tool before you can use Tableau for data discovery.
The couple times I tried to implement Tableau for a company, I had to work all night in SQL Server Express to create a data model that made Tableau easy to use. It was this experience that made me realize that data discovery does not depend on great data visualization alone. It also depends on being able to easily extract, transform, and model data.
Don’t be fooled by specialization of software
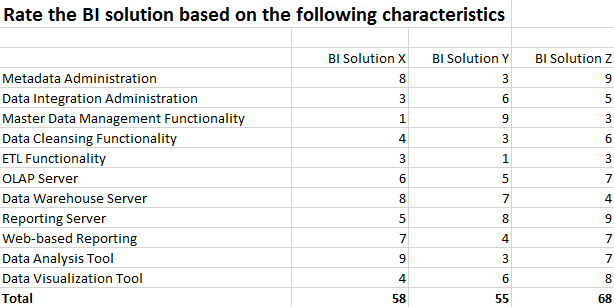
Sometimes you’ll encounter those that think just because a software has a dedicated consultant and component for integrating data, managing master data, defining metadata, creating a data warehouse, constructing cubes, generating reports and designing web interfaces, it must be better at each for those tasks than a single tool like QlikView.
At one time even I believed a specialized tool from a traditional BI solution must do some magic that a single data discovery tool like QlikView can’t do. However, I’ve stopped believing in such silliness after seeing how those tools perform in the real-world. For example, a couple years ago I delivered a profitability application filled with prorations faster in QlikView than in Oracle’s dedicated profitability module.
However, the belief that specialized tools are better still persists, and it yields its ugly head every I encounter a request of proposal (RFP). If you’ve come across a RFP for a traditional BI project, you’ve probably encountered a table where the customer numerically evaluates how each BI software supports a long list of features. The numbers are then summed to pick a winner. Traditional BI is an expert at convincing customers with this type of decision making. It’s long list of product features, canned demos, and PowerPoints make it appear to be a better product.
However, if you want to make a bad decision or prolong a good decision, then continue to use these evaluation methods, or Rational Choice methods. In a great book about decision making called “Streetlights and Shadows”, Gary Klein explains how useless or damaging these Rational Choice methods can be. Gary claims that experts make good decisions by picking from a short list of options and then imagining possible outcomes based on experience.
Data discovery tools take advantage of this theory of decision-making by making it so easy for people to imagine possible outcomes even when they don’t have previous experience with this type of tool. We make it easy to imagine these possible outcomes when we create the famous proof of concept.
We can deliver these proof of concepts so quickly because we work with a tool that doesn’t depend on specialized tools or consultants to extract and transform data. When a company asks for a proof of concept to evaluate QlikView and the other BI tools, it is common for the others to lose time because they lack the availability of specialized consultants or are confused about which tool use. That is not the case with QlikView.
Full-featured data discovery is the future
Some of us may still dream of the efficiency and the control we see in factories or fast-food restaurants when we implement BI projects, but such a idea is counter-productive. The business requirements for a BI project tend to be constantly change. Such a scenario is not ideally managed by a long production line of highly specialized tools and human resources.
Imagine investing weeks integrating and modeling data based on requirements the business user gave us. Then imagine that the business user sees our first reports halfway through the project and tells us that we’ve been integrating the wrong data sources. Although people will blame the project analysis work done previous the data integration, the problem would have been solved if from the first week, the user was already exploring the data in an all-in-one tool like QlikView.
It is also important to understand that this scenario is not due to a company’s immaturity. I still run across a few examples of customers that start to work with QlikView with the idea that at some point they should migrate to a more mature, tradition BI solution. These customers fail to realize that nor the data nor the users are going to be any more predictable in the future as they are now.
According to IDC there are 4.4 zettabytes of information as of 2013, or 4.4 billion terabytes. If 10 terabytes is the size of the Library of Congress than there are 440 million copies of the Library of Congress out there. Considering that the volume of data is growing around 40-60% year over year and that only 1.5% of all those zettabytes of data is highly valuable, it is going to be vital for any company to extract, transform and model data as quickly as possible. A customer that wants to migrate from QlikView to a traditional BI is like a mouse wanting to become a dinosaur before the comet hits.
Avoid making QlikView into a traditional BI
As I mentioned in my previous post, data discovery tools concentrate first on discovery, second on distributing that discovery and third on organizing the data. This contrasts with traditional BI’s focus on first organizing the data.
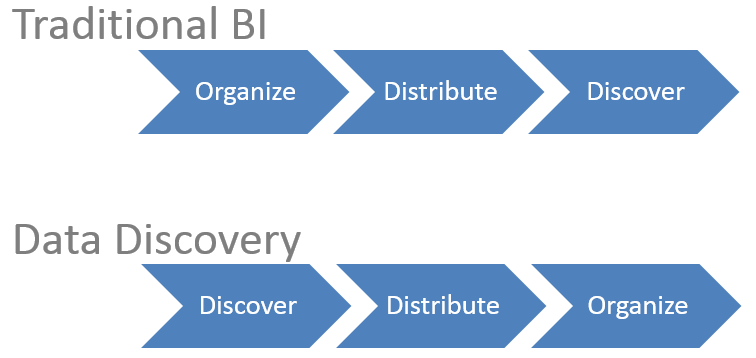
It’s a shame that once we’ve created our first successful QlikView application, we then proceed to make a data discovery tool like a traditional BI tool. In a similar way that rebels overthrow a dictator only to become a dictator themselves, we promote QlikView’s flexibility only to kill it once we start implementing it over our whole enterprise. We end up implementing QlikView with the organize, distribute, and discover mentality.
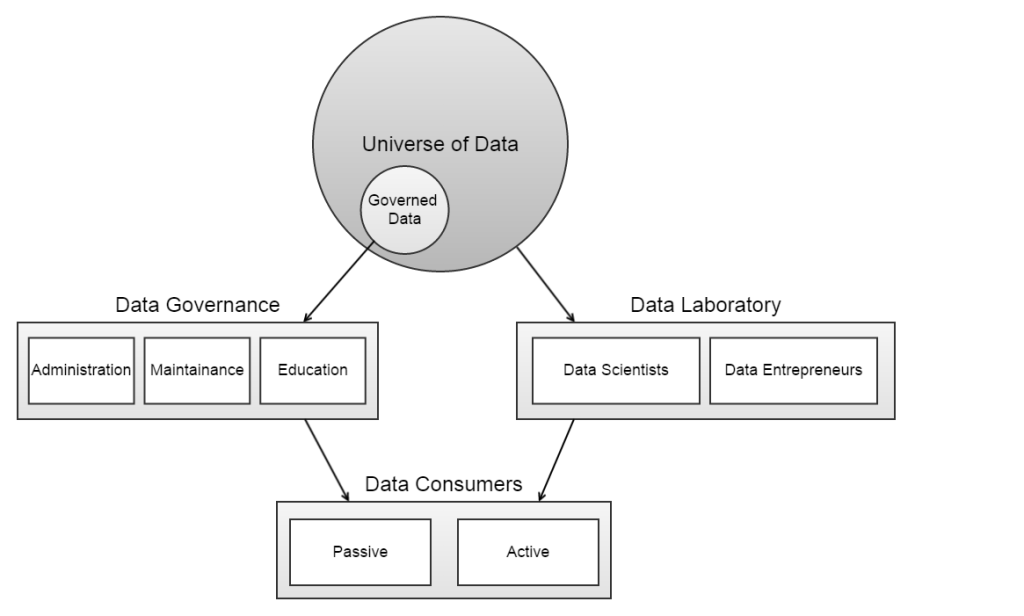
This is not to say that some type data governance is not important. It is a vital part of gaining the trust of every business user. However, it is equally important to maintain a team dedicated to innovation that is continually using QlikView from data extraction to data visualization in order to explore new data and new ways to analyze existing data.
In my opinion, governance and innovation to not mix, so these teams should be separate as the shown in the following diagram. I call this team the data research and development team, and it is given the same flexibility with which we created our first QlikView application. Obviously, more can be said of this diagram, but we’ll leave that for another post.
The next part of this series includes a look into how real-time analysis is an essential part of data discovery.
See you around,
Karl

Leave a comment