I love the analysis that can be done using Qlik’s Set Analysis, but its syntax leaves too many business users lost and confused. Those same business users that use Excel today for their analytical needs and aren’t completely convinced that Qlik is accessible enough to perform their own custom analysis.
I believe that one day applying simple and complex business rules will be made easier, but until then, I’m going to share tips and tricks to keep Set Analysis syntax as simple as possible. Additionally, I will use examples of commonly used indicators that you can re-use for your own Qlik applications.
One of the confusing attributes of Set Analysis syntax is knowing when to use double quotes ( ” ) and when to use single quotes ( ‘ ). According to Qlik Help (a great resource),
A search is always defined by the use of double quotes, e.g. <Ingredient = {"*Garlic*"}>
will select all ingredients including the string ’garlic’.
A search can also be based on a formula or a range. For example, <Customer = {“=sum(Sales)>10000”}> will select all customers that have a sum of sales greater than ten thousand and <Year={“>=2008<=2010”}> will select all including between and including 2008 and 2010.
On the other hand, a single quote ( ‘ ) denotes a string value. For example, <Customer = {‘Alles Lusekofter’}>. However clear this may be to some, it can be perplexing to others. It is made even more confusing by the fact that in practice there doesn’t appear to be any difference between using the double quote ( ” ) and the single quote ( ‘ ). For example, <Customer = {‘Alles Lusekofter’}> will give you the same result as <Customer = {“Alles Lusekofter”}>, and contrary to what Qlik Help states, <Ingredient = {‘*Garlic*’}> returns the same result as <Ingredient = {“*Garlic*”}>.
Subsequently, when we train others who don’t have a technical background to write Set Analysis, it is important to remain consistent and keep the expressions as simple as possible. The easiest solution is to always use either one or the other.
The only acceptable exception to this rule would be when we use nested Set Analysis. Nested Set Analysis is when we use an advanced search to filter a field that itself is also filtered by Set Analysis. For example,
<Customer = {"=sum( {lt;Ingredient={'*Garlic*'}>} Sales)>10000"}>
will filter the customers that have sales greater than ten thousand for products containing garlic.
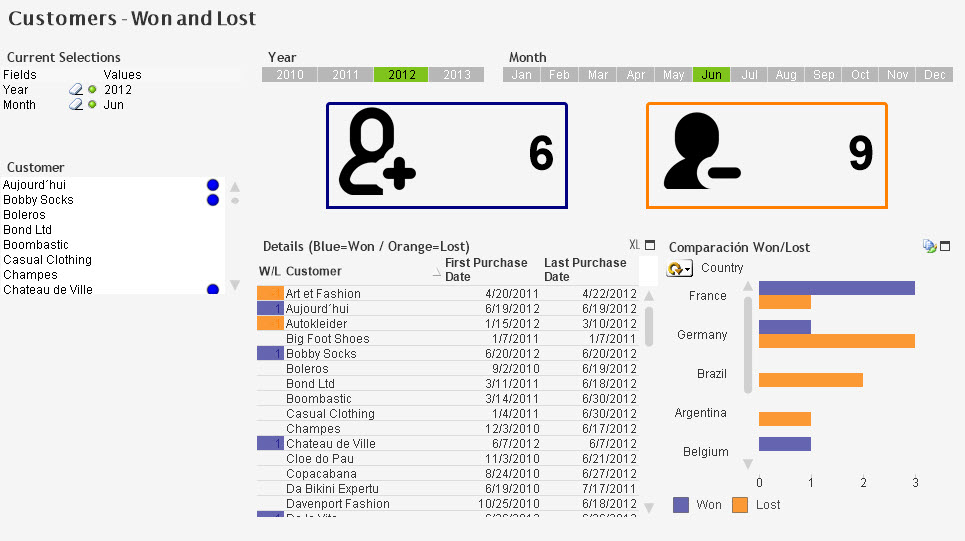
One real world application of nested Set Analysis helps us define the business rules that define the indicators for won and lost customers, which are key indicators in any sales application. Our example business rules are the following:
- New customers are those that purchased for the first time ever anything within the previous 30 days.
- Lost customers are those that have purchased historically within the last 120 days, but have not purchased anything within the previous 60 days.
- The indicators can be viewed for previous months and not just the current month
- Only consider positive sales transactions (no returns)
Our data model includes a master calendar with Month, Year, YearMonth, and OrderDate; a customer catalog; and a fact table with a Sales field.
In short, the expression is going to calculate the first and last time each customer made a purchase before the date selected by the user and see if it falls within the range of days defined in the business rules we previously defined.
If we were to calculate the first time a customer made a purchase before the date selected by the user we would use the following expression,
min({lt;Sales={'>0'}, Year=, Month=, YearMonth=, OrderDate={'<=$(=max(OrderDate))'}>}
OrderDate)
and we only need to change the min to a max in order to calculate the last time a customer made a purchase,
max({lt;Sales={'>0'}, Year=, Month=, YearMonth=, OrderDate={'<=$(=max(OrderDate))'}>}
OrderDate)
Notice we used single quotes ( ‘ ) in the search expressions found the in the Set Analysis included in the previous formulas. Now, we take a simple count distinct,
count(distinct Customer)
and add the previous formulas that calculated the first and last times a purchase was made and compare it to the maximum date selected by the user,
=max(OrderDate)
in an advanced search in our Set Analysis.
If the first date a purchase was made is less the 30 days it is considered a new customer, and if the last date a purchase was made is between 60 and 120 days it is considered a lost customer. Our resulting expressions are as follows.
New Customers
count({lt;Year=, Month=, YearMonth=,Customer={"=min({lt;Sales={'>0'}, Year=, Month=,
YearMonth=, OrderDate={'<=$(=max(OrderDate))'}>} OrderDate)>=$(=max(OrderDate)-30)"}>}
distinct Customer)
Lost Customers
count({lt;Year=, Month=, YearMonth=,Customer={"=max({lt;Sales={'>0'}, Year=, Month=,
YearMonth=, OrderDate={'<=$(=max(OrderDate))'}>} OrderDate)< $(=max(OrderDate)-60)
and max({lt;Sales={'>0'}, Year=, Month=,
YearMonth=, OrderDate={'<=$(=max(OrderDate))'}>} OrderDate)>= $(=max(OrderDate)-120)"}>}
distinct Customer)
Notice we used double quotes ( “ ) to surround the nested advanced search expression. Additionally, it is important to remember that we have to repeat ignored fields (i.e. Year, Month and YearMonth) in both the outside and nested Set Analysis.
Other great indicators that can be done in a similar fashion are the numbers of recovered and at-risk customers. I look forward to any questions, comments, or improvements that anybody would like to contribute to this post.
If you have a Qlik license you can download and review the following Qlik application. If you have the Qlik Personal Edition, the formulas in this post should work in the What’s New in QlikView 11 example with a little adjusting.
Hope to see you around,
Karl

Leave a comment